Spotting Neighborhoods with Strong Community Revitalization Efforts
27 October 2026
Community revitalization is one of the most reliable signals a real estate buyer or investor can track, yet it is also one of the most misunderstood. Plenty of neighborhoods look like they are turning around. Far fewer actually are. The gap between the two is where money gets made and where money gets lost, and the difference usually comes down to whether you can read the underlying evidence rather than the surface story.
This article is about how to read that evidence. It covers what genuine revitalization looks like on the ground, which indicators carry real weight and which ones are noise, how to distinguish a durable turnaround from a short-lived spike, and how to position yourself before the rest of the market catches on. The focus is on practical observation and disciplined analysis, not hype.
What Community Revitalization Actually Means
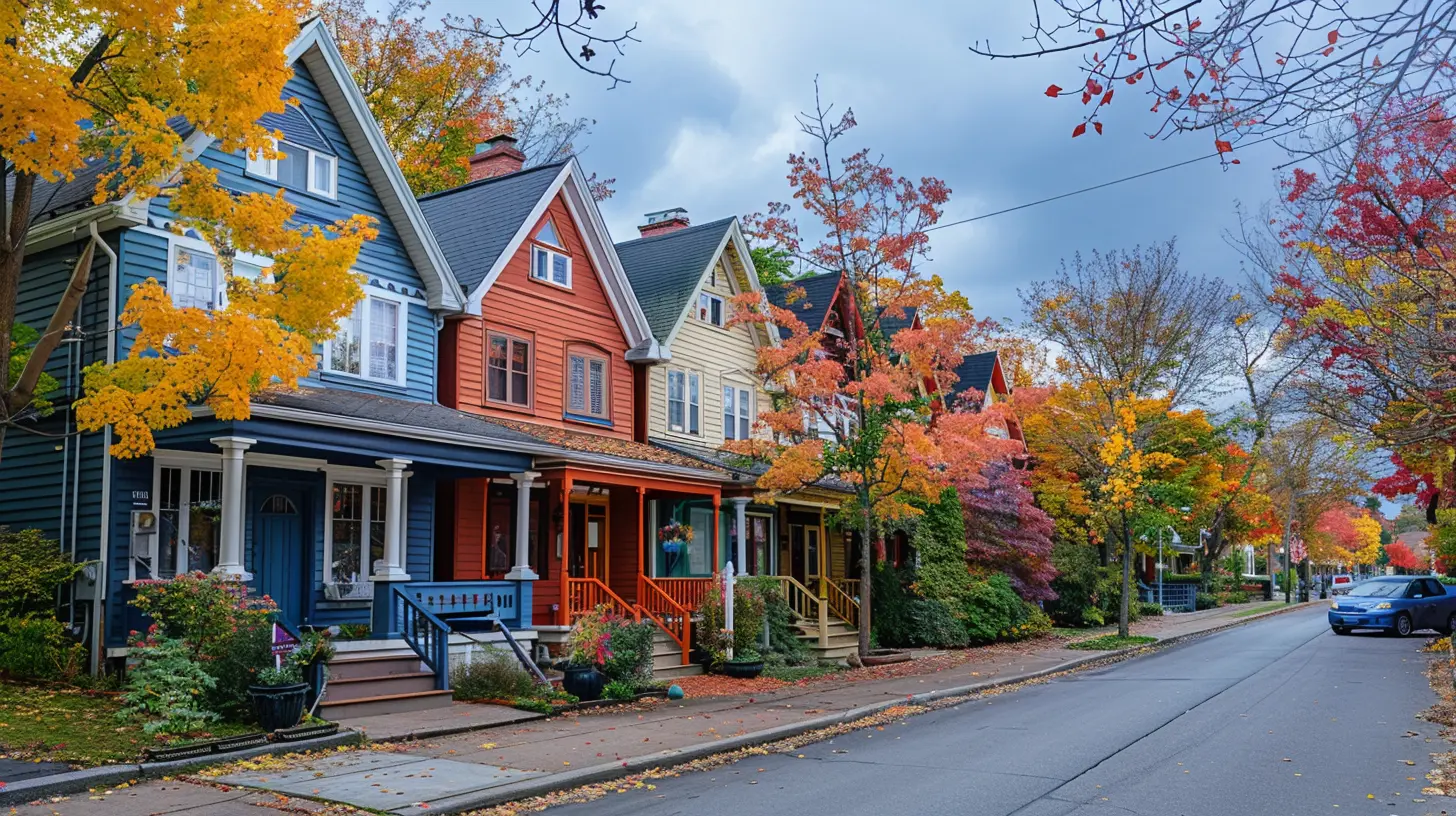
Revitalization is not the same as gentrification, though the two often get conflated. Gentrification describes a demographic and economic shift, usually driven by outside capital moving into a lower-income area. Revitalization is broader: it is the restoration of a neighborhood's physical, social, and economic health. A neighborhood can revitalize without gentrifying, and it can gentrify without genuinely revitalizing. The distinction matters because the first tends to produce stable, lasting value, while the second can produce volatility and displacement that undermine the very conditions that attracted investment in the first place.Genuine revitalization typically shows up across several dimensions at once:
- Physical: deferred maintenance gets addressed, vacant properties get occupied, infrastructure improves.
- Economic: new businesses open and stay open, employment rises, property values recover from a depressed baseline.
- Social: residents organize, institutions like schools and churches strengthen, public spaces get used.
- Institutional: local government and lenders direct resources toward the area, and code enforcement becomes consistent rather than sporadic.
The reason to look for multiple dimensions is that any single indicator can be faked or can occur by accident. A cluster of new coffee shops means little if the housing stock is still deteriorating and residents are leaving. Real revitalization is a system effect, and systems produce correlated signals.
Why Timing Matters More Than Almost Anything Else
The single biggest determinant of returns in a revitalizing neighborhood is not which neighborhood you pick. It is when you enter it. Enter too early and your capital sits idle for years while the turnaround stalls or reverses. Enter too late and the upside has already been priced in.The useful mental model is a curve with four phases. In the first phase, conditions are still deteriorating but at a slowing rate. In the second, the bottom is in and small signs of stabilization appear. In the third, visible improvement attracts attention and prices rise quickly. In the fourth, the neighborhood is fully repriced and behaves like any established area.
Most of the profit sits between the second and third phases. The challenge is that the second phase is precisely when the neighborhood looks worst to casual observation. That is why disciplined indicators matter: they let you see stabilization before it becomes obvious.
The Indicators That Actually Carry Weight
Not all signals are created equal. Some are leading, some are coincident, and some are lagging. Confusing them is a common and expensive mistake.Leading Indicators
These tend to move before prices do.Permit activity for renovation, not just new construction. A rise in permits for interior alterations and additions suggests existing owners and small investors are committing capital. That is a stronger signal than a single large new development, which can be a one-off project with no broader follow-through. Check whether permits are spread across many addresses or concentrated in a few. Spread is the healthier pattern.
Small-scale commercial openings with local operators. A new bakery run by a neighborhood resident, a barber shop expanding, a restaurant opening a second location: these signal that people with local knowledge believe the area has a future. National chains arriving is a lagging signal, not a leading one. By the time a large chain commits, the easy money has usually been made.
Changes in code enforcement and municipal attention. When a city starts citing absentee owners, boarding up problem properties, or resurfacing streets, it often reflects a deliberate policy shift. This is one of the most underrated indicators because it is public information and rarely priced in.
Occupancy trends in rental stock. Falling vacancy, shorter days-on-market for rentals, and rising rents in a formerly soft market all point to demand returning before sale prices reflect it.
Coincident Indicators
These confirm what is already happening.- Sale prices moving off a long flat or declining baseline.
- Days on market compressing.
- Owner-occupancy rates rising as investors sell to end users.
- School enrollment stabilizing or growing.
Lagging Indicators
These tell you the story after the fact and are the least useful for decision-making.- Media coverage of the neighborhood as "up and coming."
- Large institutional investment arriving.
- New luxury developments breaking ground.
- Rapid price appreciation that outpaces local income growth.
A common mistake is treating lagging indicators as confirmation of a thesis that is already past its best entry point. If the local paper has run a feature on the neighborhood's revival, you are likely in phase three or four.
Reading the Physical Environment
Walking a neighborhood tells you things no dataset will. But you need to know what to look for.Maintenance Signals
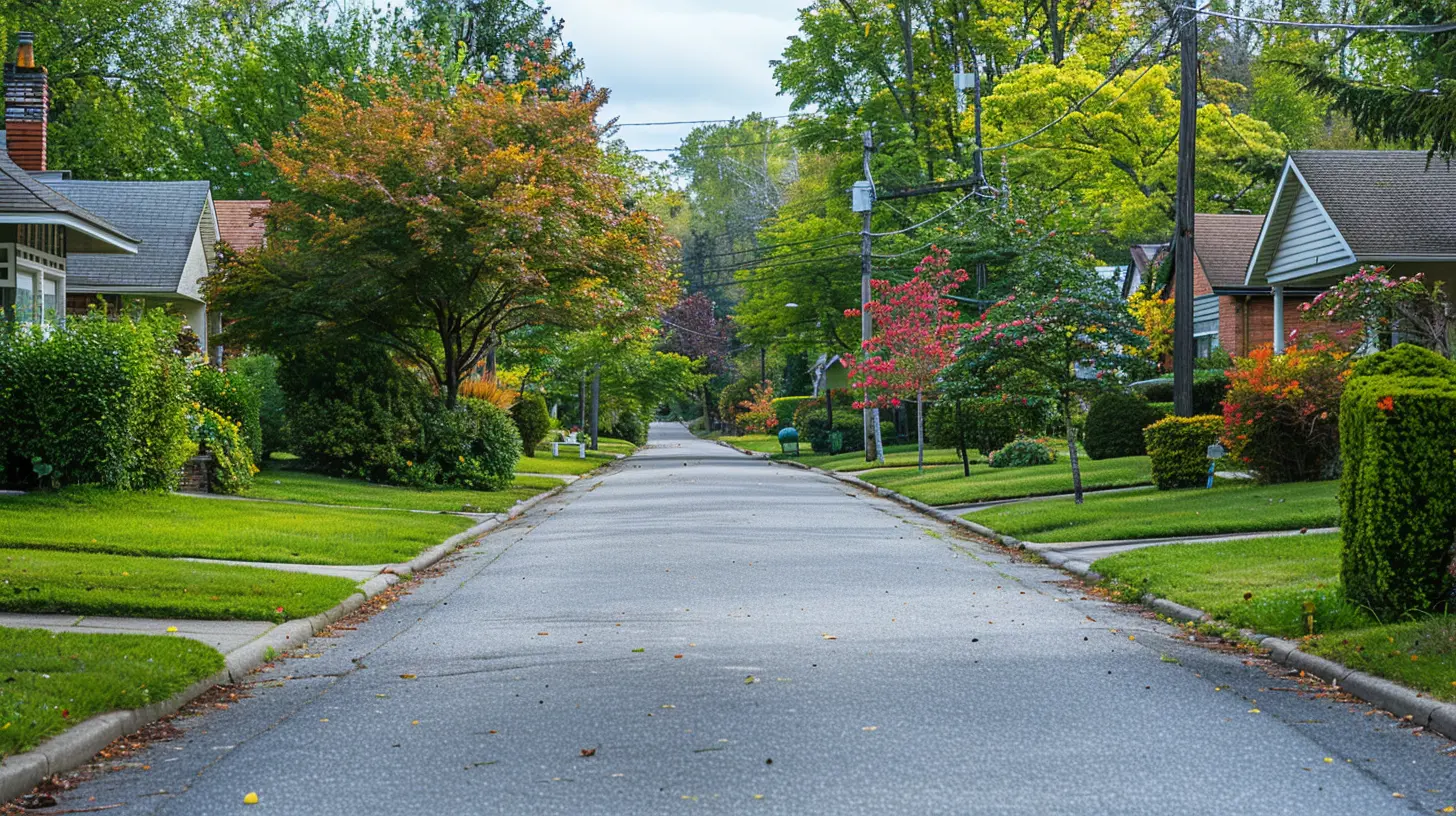
Look at the "middle" of the housing stock, not the best or worst properties. The best-kept houses are often long-term owners who have always maintained. The worst are often absentee or distressed. The middle is where you see whether ordinary residents are investing. Fresh paint, new roofs, updated windows, and tidy yards on average homes indicate that people believe in the area and are willing to spend on it.The Vacancy Pattern
Vacancy is not binary. A few scattered vacant properties are normal in almost any neighborhood. What matters is the pattern. Concentrated vacancy on a single block is a warning sign, often indicating a problem landlord, a planned demolition, or an environmental issue. Dispersed vacancy that is shrinking over time is a sign of recovery.Also distinguish between types of vacancy. A boarded property with a maintained yard is different from one with broken windows and overgrowth. The first suggests an owner managing an asset. The second suggests abandonment.
Public Space Usage
Parks, libraries, and community centers are honest indicators. A park that is used at multiple times of day, by multiple age groups, is a sign of social health. A park that is empty or used only for illicit activity signals the opposite. Visit at different times: weekday mornings, weekend afternoons, and evenings. The pattern tells you who feels safe and welcome.Infrastructure and Streetscape
New sidewalks, street trees, lighting, and traffic calming are expensive and usually reflect municipal commitment. They also tend to precede private investment because they reduce perceived risk. A neighborhood that has recently received this kind of investment is often at the start of a positive cycle.The Institutional Layer Most Buyers Ignore
The most durable revitalization is usually backed by institutions, and institutions leave paper trails.Municipal Plans and Zoning Changes
Check the city's comprehensive plan, neighborhood plans, and recent zoning decisions. Upzoning, form-based code adoption, or the designation of a tax increment financing district are strong signals that public resources will flow toward an area. These documents are public and are usually available well before the effects become visible.Be careful, though: plans are not the same as execution. Look for funded plans with line items in the capital budget, not just aspirational documents. A plan with money behind it is a signal. A plan without funding is a wish.
Community Development Financial Institutions and Local Banks
CDFIs and community banks often lead where national lenders lag. If local lenders are actively making loans in an area, they have usually done their own due diligence. You can sometimes infer this from recorded mortgages and from the presence of local bank branches, though branch closures complicate the picture.Anchor Institutions
Universities, hospitals, and large employers have long time horizons and strong incentives to stabilize their surroundings. A hospital that expands into an adjacent neighborhood, or a university that builds staff housing nearby, creates a durable demand floor. These institutions rarely make short-term bets, so their presence is a meaningful signal.Community Organizations
Active neighborhood associations, faith-based organizations, and nonprofits focused on housing or workforce development are signs of social capital. Social capital is hard to measure but strongly correlated with successful revitalization. A neighborhood with organized residents can advocate for resources, hold landlords accountable, and sustain momentum through economic cycles.
Distinguishing Revitalization from a Short-Lived Spike
Not every improvement lasts. Some neighborhoods experience a burst of activity that fades within a few years. The question is how to tell the difference.Check the Duration of Trends
A single year of rising prices or new businesses is not a trend. Look for at least three to five years of consistent movement in the same direction. Longer is better. Revitalization is slow by nature because it involves physical improvements, institutional change, and shifts in perception, all of which take time.Look for Breadth
A spike is often narrow: one developer, one block, one business type. Revitalization is broad: multiple property types, multiple business categories, multiple blocks. Breadth is the signature of a system effect rather than a single actor.Assess the Underlying Economics
Ask whether the improvement is supported by fundamentals. Are local incomes rising? Is employment stable? Is there a reason for people to move there, such as proximity to jobs, transit, or amenities? Improvements that are not supported by fundamentals tend to reverse when external capital withdraws.Watch for Displacement Pressure
Paradoxically, rapid displacement of existing residents can be a warning sign rather than a positive one. If long-term residents are being pushed out faster than new ones can be absorbed, the social fabric that made the neighborhood attractive erodes. This can lead to instability, political backlash, and policy changes that dampen investment. Sustainable revitalization usually involves some turnover, but it also involves retention.Common Mistakes and Misconceptions
Mistake: Chasing the Headlines
By the time a neighborhood is in the news, the best entry point has usually passed. Media coverage is a lagging indicator. Use it to understand what happened, not to decide what to do next.Mistake: Confusing New Construction with Revitalization
A single large development can transform a skyline without transforming a neighborhood. If the new building is isolated, gated, or disconnected from the surrounding streets, it may not generate the spillover effects that drive broad improvement. Look for projects that integrate with the existing fabric.Mistake: Ignoring the Surrounding Context
A neighborhood does not exist in isolation. Its prospects depend on adjacent areas, transportation links, and regional economic trends. A strong block surrounded by weak ones is fragile. A modest block adjacent to a strong, improving area is often a better bet.Misconception: Revitalization Always Means Rising Prices
Prices usually rise, but not always immediately and not always smoothly. In early phases, prices can stay flat or even dip as distressed properties clear. The relationship between physical improvement and price appreciation is real but lagged and uneven.Misconception: You Need to Buy in the Best Block
Buying the best house on the best block in an improving neighborhood often means paying a premium that erases the upside. Buying a solid house on a good block adjacent to the best block can capture more appreciation with less risk. The goal is to be slightly ahead of the curve, not at its peak.
Practical Steps for Evaluating a Neighborhood
A disciplined process beats intuition. Here is a sequence that works.1. Define the boundary. Neighborhoods are fuzzy. Pick a specific area, ideally bounded by major streets, transit lines, or natural features, and stay consistent.
2. Pull the public data. Permits, sales records, vacancy data, crime statistics, school enrollment, and municipal plans. Look for multi-year trends, not snapshots.
3. Walk the area at different times. Weekday, weekend, morning, evening. Note maintenance, occupancy, and activity patterns.
4. Talk to people. Local business owners, librarians, postal workers, and long-term residents are often the best sources. Ask open questions about what has changed and what has not.
5. Check the institutional layer. Look for funded plans, active lenders, anchor institutions, and organized community groups.
6. Stress-test the thesis. Ask what would have to be true for this to fail. Identify the specific risks and whether they are manageable.
7. Compare to alternatives. Revitalization theses are relative. A neighborhood may be improving but still be a worse bet than another area with stronger fundamentals.
Weighing the Trade-Offs
Every revitalization play involves trade-offs, and honest analysis means naming them.Early entry versus risk. Entering early offers the largest upside but the longest holding period and the highest chance of being wrong. Later entry reduces risk but compresses returns. Your choice should reflect your capital structure, time horizon, and tolerance for uncertainty.
Owner-occupancy versus investment. Owner-occupants stabilize neighborhoods and often get better financing terms, but they are less flexible. Investors can move faster but can also contribute to the instability they are trying to profit from. Being aware of your role in the neighborhood's trajectory is both ethical and practical.
New construction versus renovation. New construction can catalyze change but often does so in a way that is disconnected from existing residents. Renovation of existing stock tends to produce more gradual, more integrated improvement. Both can work, but they produce different neighborhood outcomes.
Data versus ground truth. Data is scalable and comparable, but it lags and can miss qualitative shifts. Ground truth is rich but subjective and hard to compare across areas. The best analysis uses both and treats disagreement between them as a signal to dig deeper.
Final Thoughts
Spotting neighborhoods with strong community revitalization efforts is not about finding the next hot area. It is about reading a complex system accurately and acting before the consensus forms. The indicators are there, but they are distributed across physical, economic, social, and institutional dimensions, and they require patience and discipline to interpret.The investors and buyers who do this well share a few habits. They look for breadth rather than spikes. They favor leading indicators over headlines. They check the institutional layer that most people ignore. They walk the ground and talk to the people who live there. And they stress-test their own theses rather than falling in love with them.
Revitalization rewards those who do the unglamorous work of observation and analysis. The neighborhood that looks worst on the surface is often the one with the most durable upside, provided the underlying signals are real. The skill is in telling the difference, and that skill is built through practice, not shortcuts.
all images in this post were generated using AI tools
Category:
Real Estate OpportunitiesAuthor:

Melanie Kirkland